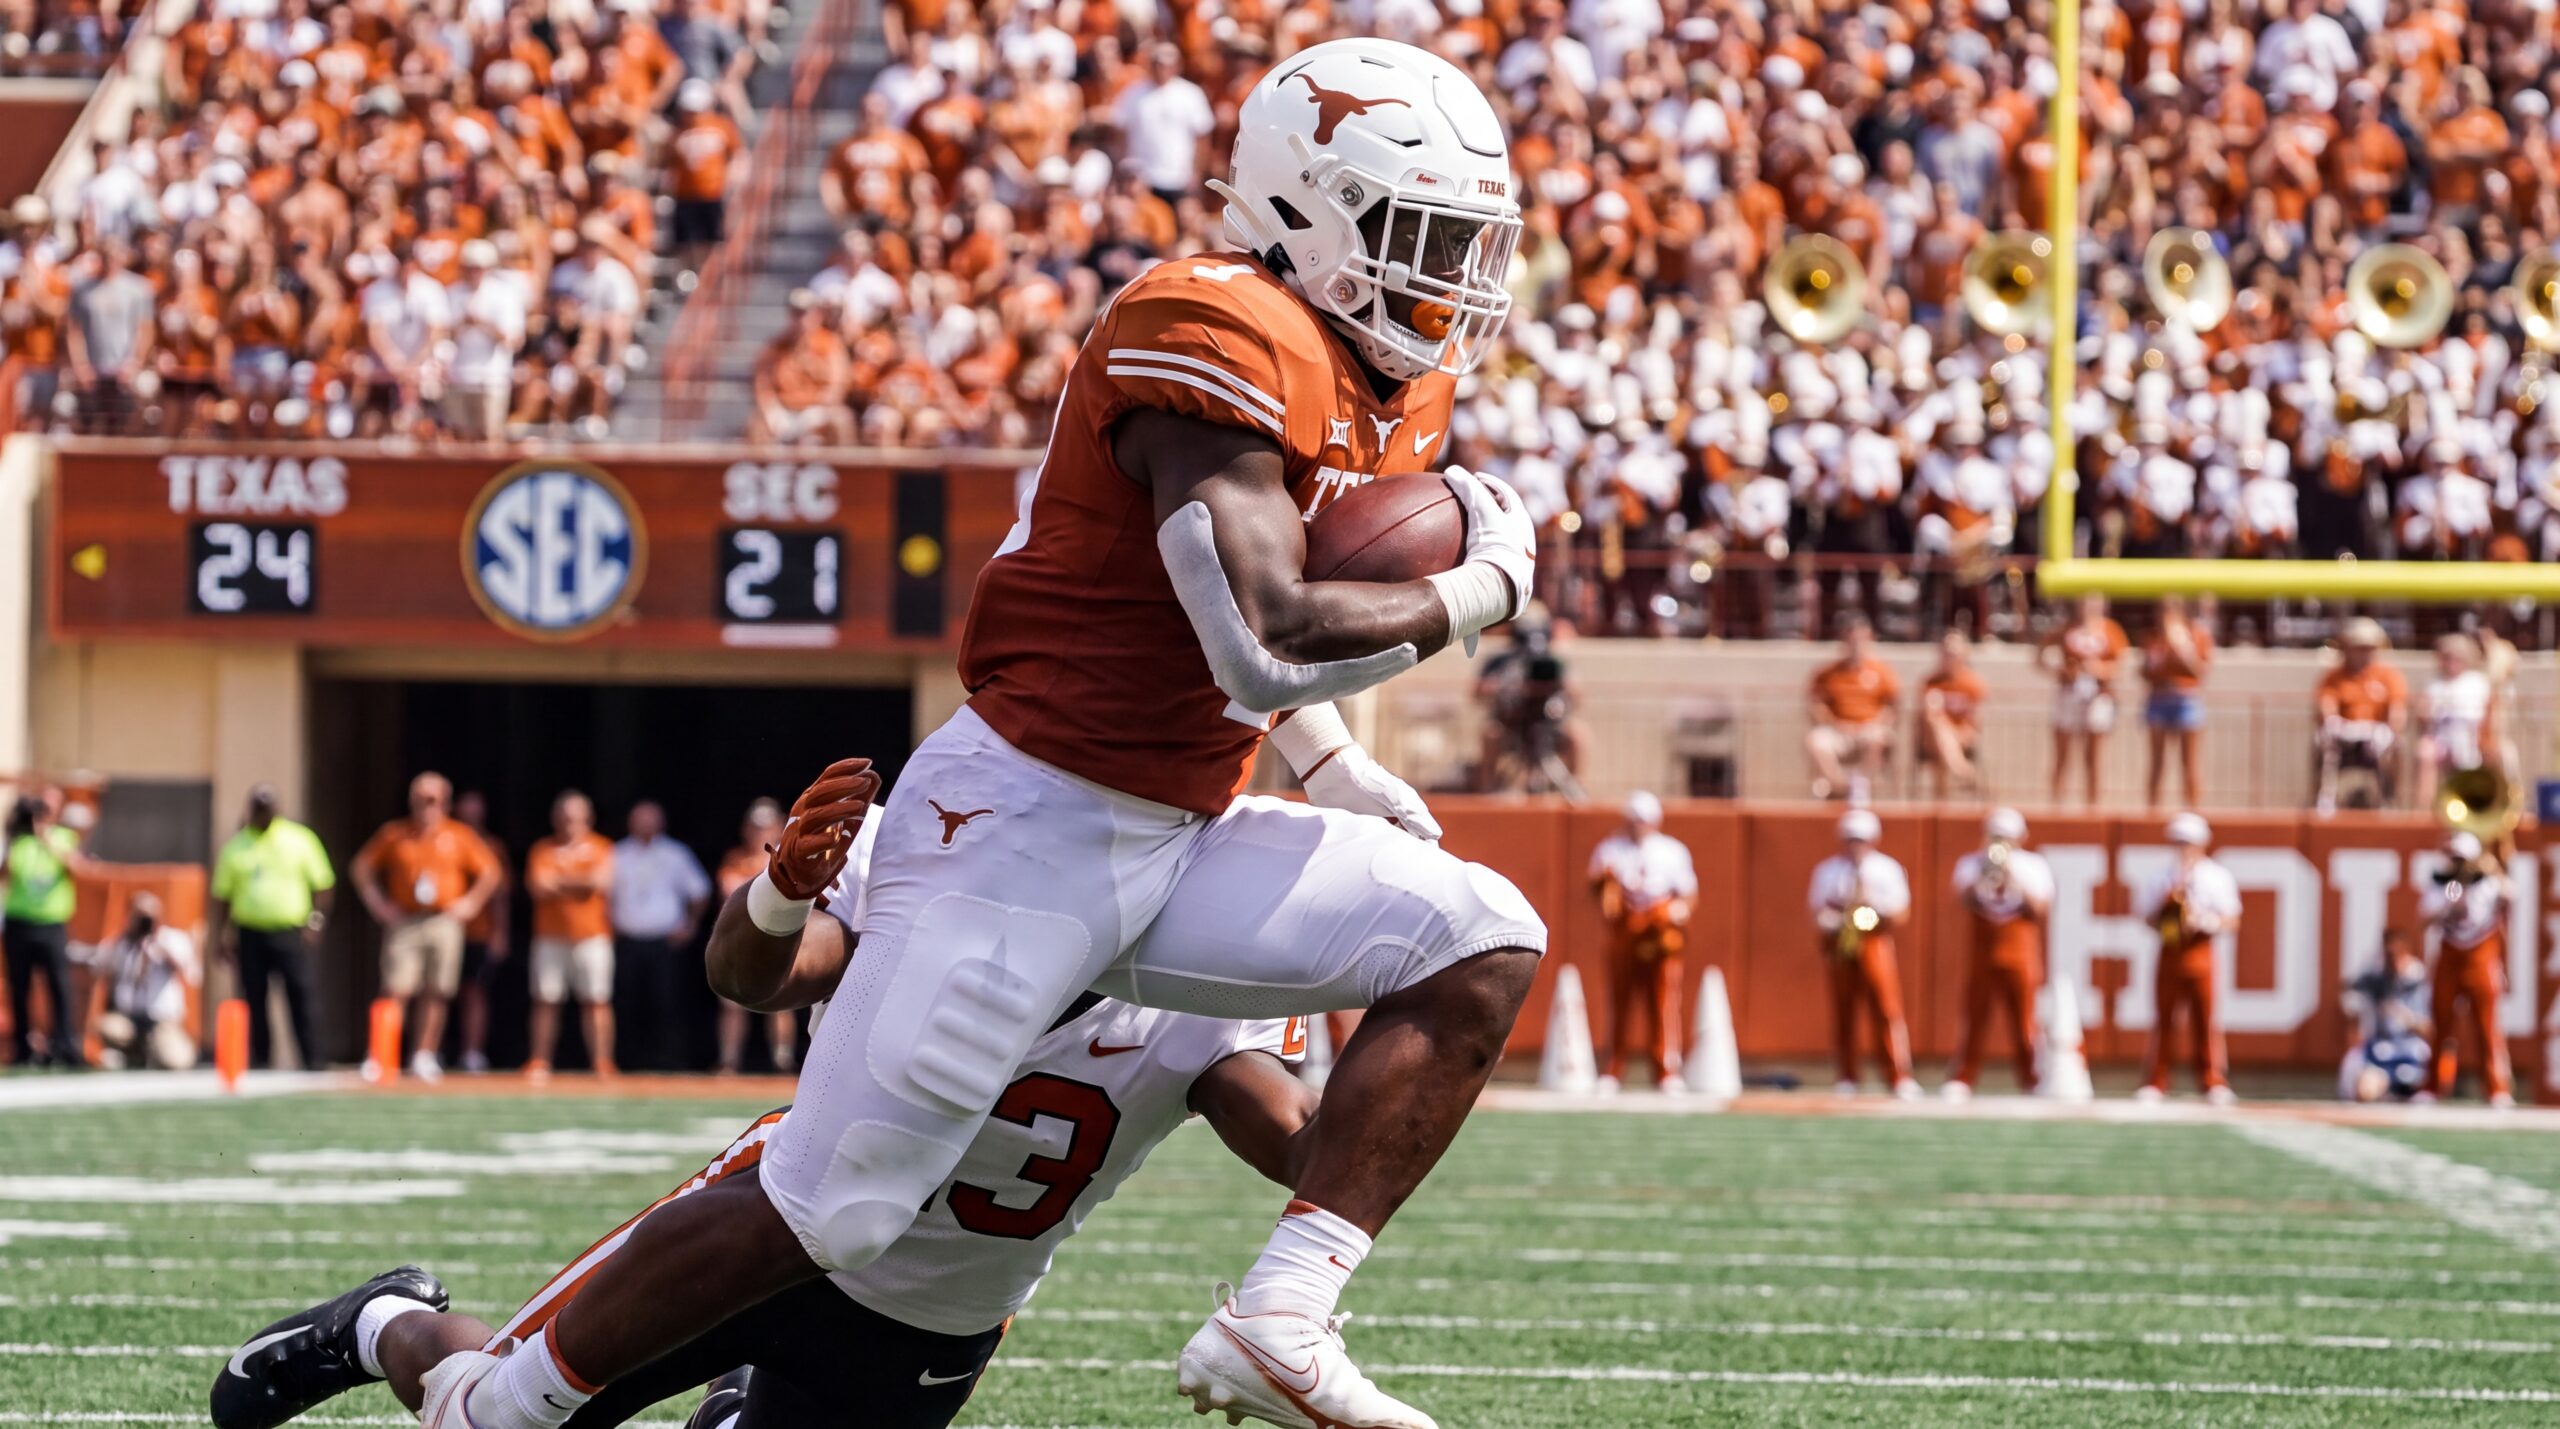
As the Texas Longhorns approach the 2026 schedule, attention will turn to the unit that often controls tempo: the Texas Longhorns running backs. This analysis opens with a short roster and role context, then dives into three under-the-radar statistics that can shift how coaches allocate snaps, how evaluators rank players and how the offense plans for opponent matchups.
Where the running back room stands entering 2026
Heading into fall prep, the Longhorns’ running back room is expected to balance veterans, younger returns and any incoming recruits or transfers. Spring and summer practices will shape depth charts, but situational needs—early-down grind work, third-down passing packages and special teams—remain drivers of snap distribution. For fans tracking timing and opponent sequencing, see the official 2026 schedule: 2026 Texas Longhorns football schedule. That schedule context helps explain why efficiency and durability metrics matter at specific points in the season.
A back who combines second-level creation and reliable pass protection multiplies an offense’s options across a long conference slate.
Three under-the-radar statistics for Texas Longhorns running backs
Sportspyder and related analytical coverage have highlighted a few less-visible metrics that matter in roster construction and game planning. Below are three metrics—defined plainly—with notes on how coaches and scouts use them when projecting 2026 performance (source: sportspyder.com; contextual recruiting notes from 247 Sports).
Breakaway Rate
Definition: Breakaway Rate is the percentage of carries that turn into long gains (commonly 15+ yards). Unlike raw yards per carry, it isolates a runner’s ability to produce game-changing plays on a per-touch basis.
Why it matters: A higher Breakaway Rate signals a back who can flip field position or score off limited opportunities. Against tougher 2026 opponents who load the box, a back with even modest volume but strong breakaway efficiency can force defenses to respect the vertical threat—changing blocking assignments and opening lanes for teammates. Sportspyder singles this metric out because it identifies players whose value exceeds their touch counts, a useful lens when depth or load management limits total carries.
Second-Level Yards per Carry (Second-Level YPC)
Definition: Second-Level YPC measures yards gained after the line of scrimmage and immediate contact—effectively how many yards a runner creates once he reaches the second level of the defense.
Why it matters: This metric separates backs who owe production primarily to blocking from those who consistently create extra yards with vision and burst. For Texas, assessing Second-Level YPC helps project which backs will sustain production when facing stronger front sevens on the 2026 schedule. Coaches and evaluators use it to estimate how a back will perform when run-block windows close more quickly than in lower-tier matchups.
Pass-Protection Win Rate
Definition: Pass-Protection Win Rate is the percentage of pass-blocking opportunities where the running back successfully neutralizes the assigned rusher within the play’s pass-block window.
Why it matters: Modern offenses prioritize three-down capability. A back who protects well is both a higher-floor contributor and more likely to see passing-down snaps. For Texas, reliable pass protection reduces quarterback pressure and preserves play designs—especially against 2026 opponents known for heavy blitzing. Coverage and recruiting evaluations (including those referenced by 247 Sports) increasingly treat pass-protection metrics as essential when projecting snap mix.
How each stat shapes player evaluation
Scouts and coaches combine these metrics with tape to form a nuanced evaluation. Breakaway Rate highlights upside; Second-Level YPC shows sustained creation; Pass-Protection Win Rate defines a player’s minimum usefulness on passing downs. A back with solid second-level production and above-average protection typically wins mixed-down duties, even if total carries lag a teammate with heavier usage but narrower skill sets.
In recruiting and transfer evaluation, staffers use these stats to predict role fit. As 247 Sports coverage often notes, roster construction favors multi-phase contributors who can handle early-down pounding, third-down receiving or pass protection—metrics that translate into more dependable playing time across a long season. Sportspyder’s analytic framing helps identify candidates whose counting stats may understate their situational value.
Why these numbers matter for the 2026 schedule
The 2026 slate includes opponents that will test both box-stuffing defenses and aggressive pass rushes. Against teams that crowd the line, Second-Level YPC and Breakaway Rate become clearer predictors of which backs can produce chunk plays. Conversely, games against pressure-heavy defenses will expose run-game contributors who struggle to pass-protect.
Over the season, coaches will rotate backs to manage wear and tear; players who can deliver sporadic explosiveness and consistently pick up protection assignments allow coordinators to maintain offensive balance and protect quarterbacks during high-leverage conference windows. Those practical effects are why front offices and media analysts pay attention to the three metrics covered here (sportspyder/247 Sports).
Key takeaways
- Breakaway Rate identifies game-changing ability beyond sheer volume.
- Second-Level YPC separates true yard-creation from line-dependent gains.
- Pass-Protection Win Rate often determines third-down and passing-down snaps.
Source attribution and reporting notes
This analysis synthesizes a sportspyder.com preview that highlighted these under-the-radar statistics for Texas’ backfield (see sportspyder link below). For recruiting and roster context we reference coverage and evaluations generally associated with 247 Sports. Publication timestamp from the source metadata: 2026-07-06T00:28:36.000Z.
Reporting note: the sportspyder preview did not publish exhaustive per-player raw datasets in the excerpt; teams and analysts should verify raw play counts, sample sizes and exact metric definitions before making player-level comparisons or roster decisions.