There are few things that change how a fan remembers a game like a clean line chart that refuses to lie. Alabama vs Kentucky game graphs make that blunt point: this one felt chaotic, then it did not.
As detailed by Roll 'Bama Roll, a six-play stretch turned a Kentucky 63% win probability into a Tide 79% figure, and the sequence reads like a microcosm of everything that went right and wrong for both teams.
Key Takeaways
- Devan Thompkins forced a sack-fumble that immediately erased Kentucky’s advantage and started the rapid win-probability reversal.
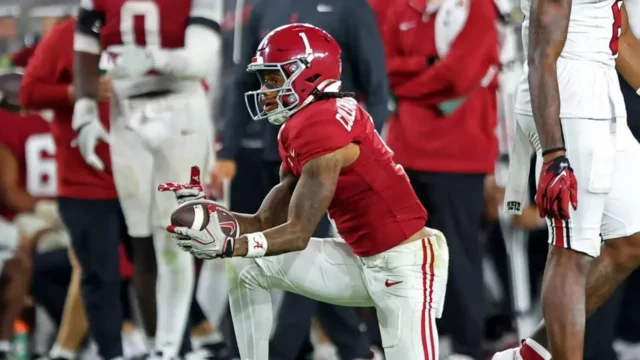
- A late sequence of Lotzier Brooks, Daniel Hill and Ezavier Crowell produced the touchdown that pushed Alabama ahead in the frame that decided the game.
- Daniel Hill’s 31-yard rush became a signature moment after replay suggested he stepped out, but the play stood and it swung the game’s momentum decisively.
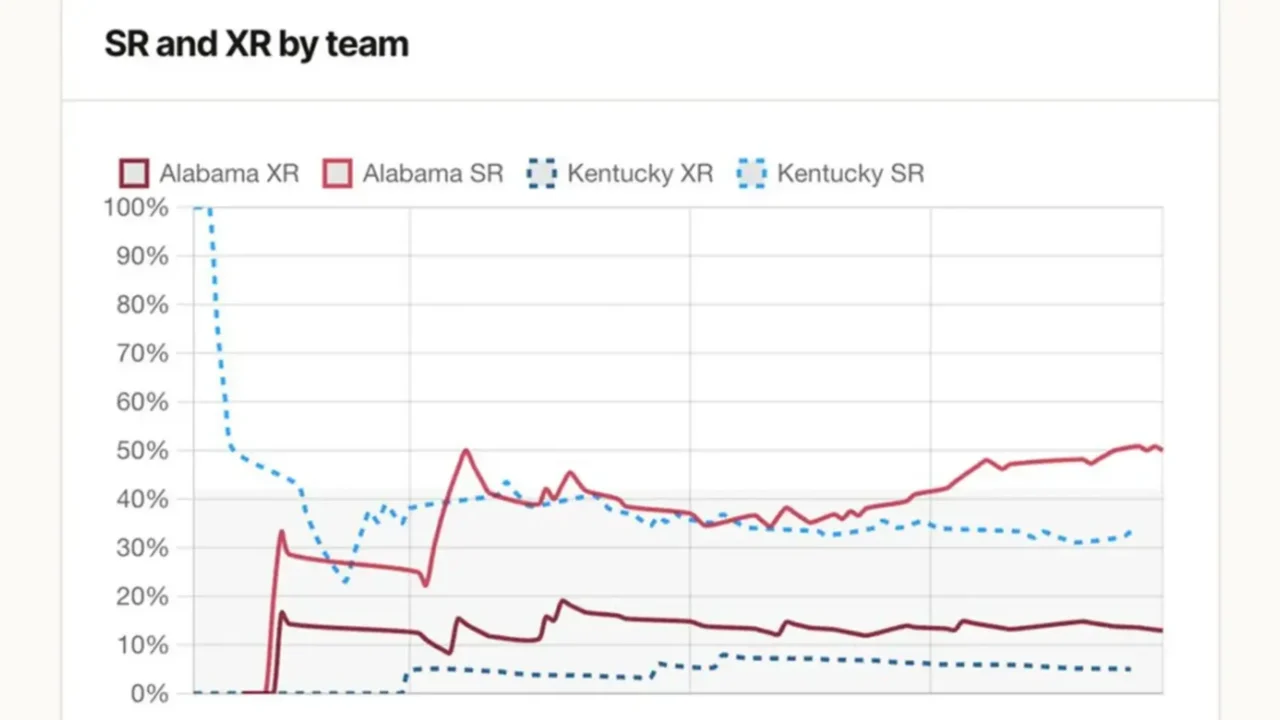
- The charts rely on CollegeFootballData.com win probability models and show Alabama’s fourth-quarter offense running at a noticeably higher success rate than earlier in the game.
How the six play swing unfolded
The sequence that flips the board happened quickly and left little time for second-guessing in the moment. The deciding hit came when Devan Thompkins stripped Kentucky quarterback Kenny Minchey, converting a Wildcat-leaning situation back to even in one play.
From that turnover the sequence continued with a short march capped by contributions from Lotzier Brooks, Daniel Hill and Ezavier Crowell that produced the touchdown putting Alabama in front. The Wildcats regained the ball and burned a possession into an attempted fake punt, which failed to change the script.
Then came the play that most people replayed: Daniel Hill’s 31-yard burst that replay reviewers said showed him stepping out of bounds, yet the call stood and the Tide pushed into a 79% win probability window shortly thereafter. The charts make plain how singular plays can generate outsized probability shifts in a short window.
Why the charts matter beyond the headline play
Win probability is a blunt instrument until you layer it with success-rate and explosiveness context, and these graphs do exactly that. Alabama’s offense, by the charts, was pedestrian early and excellent late; the fourth quarter sits well above the team’s earlier rates and correlates with the scoring surge.
Those same charts show the passing game was efficient at times despite turnovers, and the rushing ledger tells a clear story: multiple backs out-carried the quarterback, and Daniel Hill produced the longest, most consequential runs. The receiver and rushing distributions explain how the Tide found a stronger identity late.
Small procedural items also matter. Play-by-play recorder errors cropped up — a number was misattributed to the wrong player — and those misrecords can distort box-score narratives unless corrected, which the charts help surface when they deviate from film and play logs.
Alabama vs Kentucky game graphs by quarter and metric
The quarter-by-quarter views are where these charts earn their keep, showing how a middling first half can hide a late dominance that matters more in scoreboard terms. The Tide matched Kentucky through most of the third before the late sequence swung both scoring and win probability emphatically toward Alabama.
Fourth-quarter performance stands out as the decisive slice: Alabama operated at a markedly higher success rate in the final quarter and the defense tightened on late downs, producing an outcome that looks much cleaner on the scoreboard than on film for long stretches.
Game data and situational context
| Metric | Alabama | Kentucky |
|---|---|---|
| Late-game win probability swing | The charts show a six-play reversal from opponent advantage to Tide control. | Held as high as a 63% chance to win before the Tide’s decisive sequence. |
| Red zone and scoring activity | Scoring concentrated late in the third and the fourth quarter pushed the margin wide. | Only a single red-zone attempt registered in the charts, which resulted in a touchdown. |
| Fourth-quarter efficiency | Charts show a substantially higher fourth-quarter success rate, driving the comeback and final margin. | Early and mid-game efficiencies were comparable, but Kentucky could not stop the late Tide surge. |
SEC and CFP implications for Alabama
The outcome — an Alabama victory by four touchdowns — does more than pad a box score. Dominating late and covering a spread easily improves short-term perception inside the conference and bolsters a CFP profile that prizes second-half control and turnover-driven swings.
For recruiting optics and roster construction discussions, the game charts favor depth and late-game execution: effective late-quarter rushing, opportunistic defense, and special teams plays that changed field position all show up as concrete strengths on the visual ledger.
This breakdown draws on the original set of charts and the CollegeFootballData.com win probability models that underlie them.